Trends
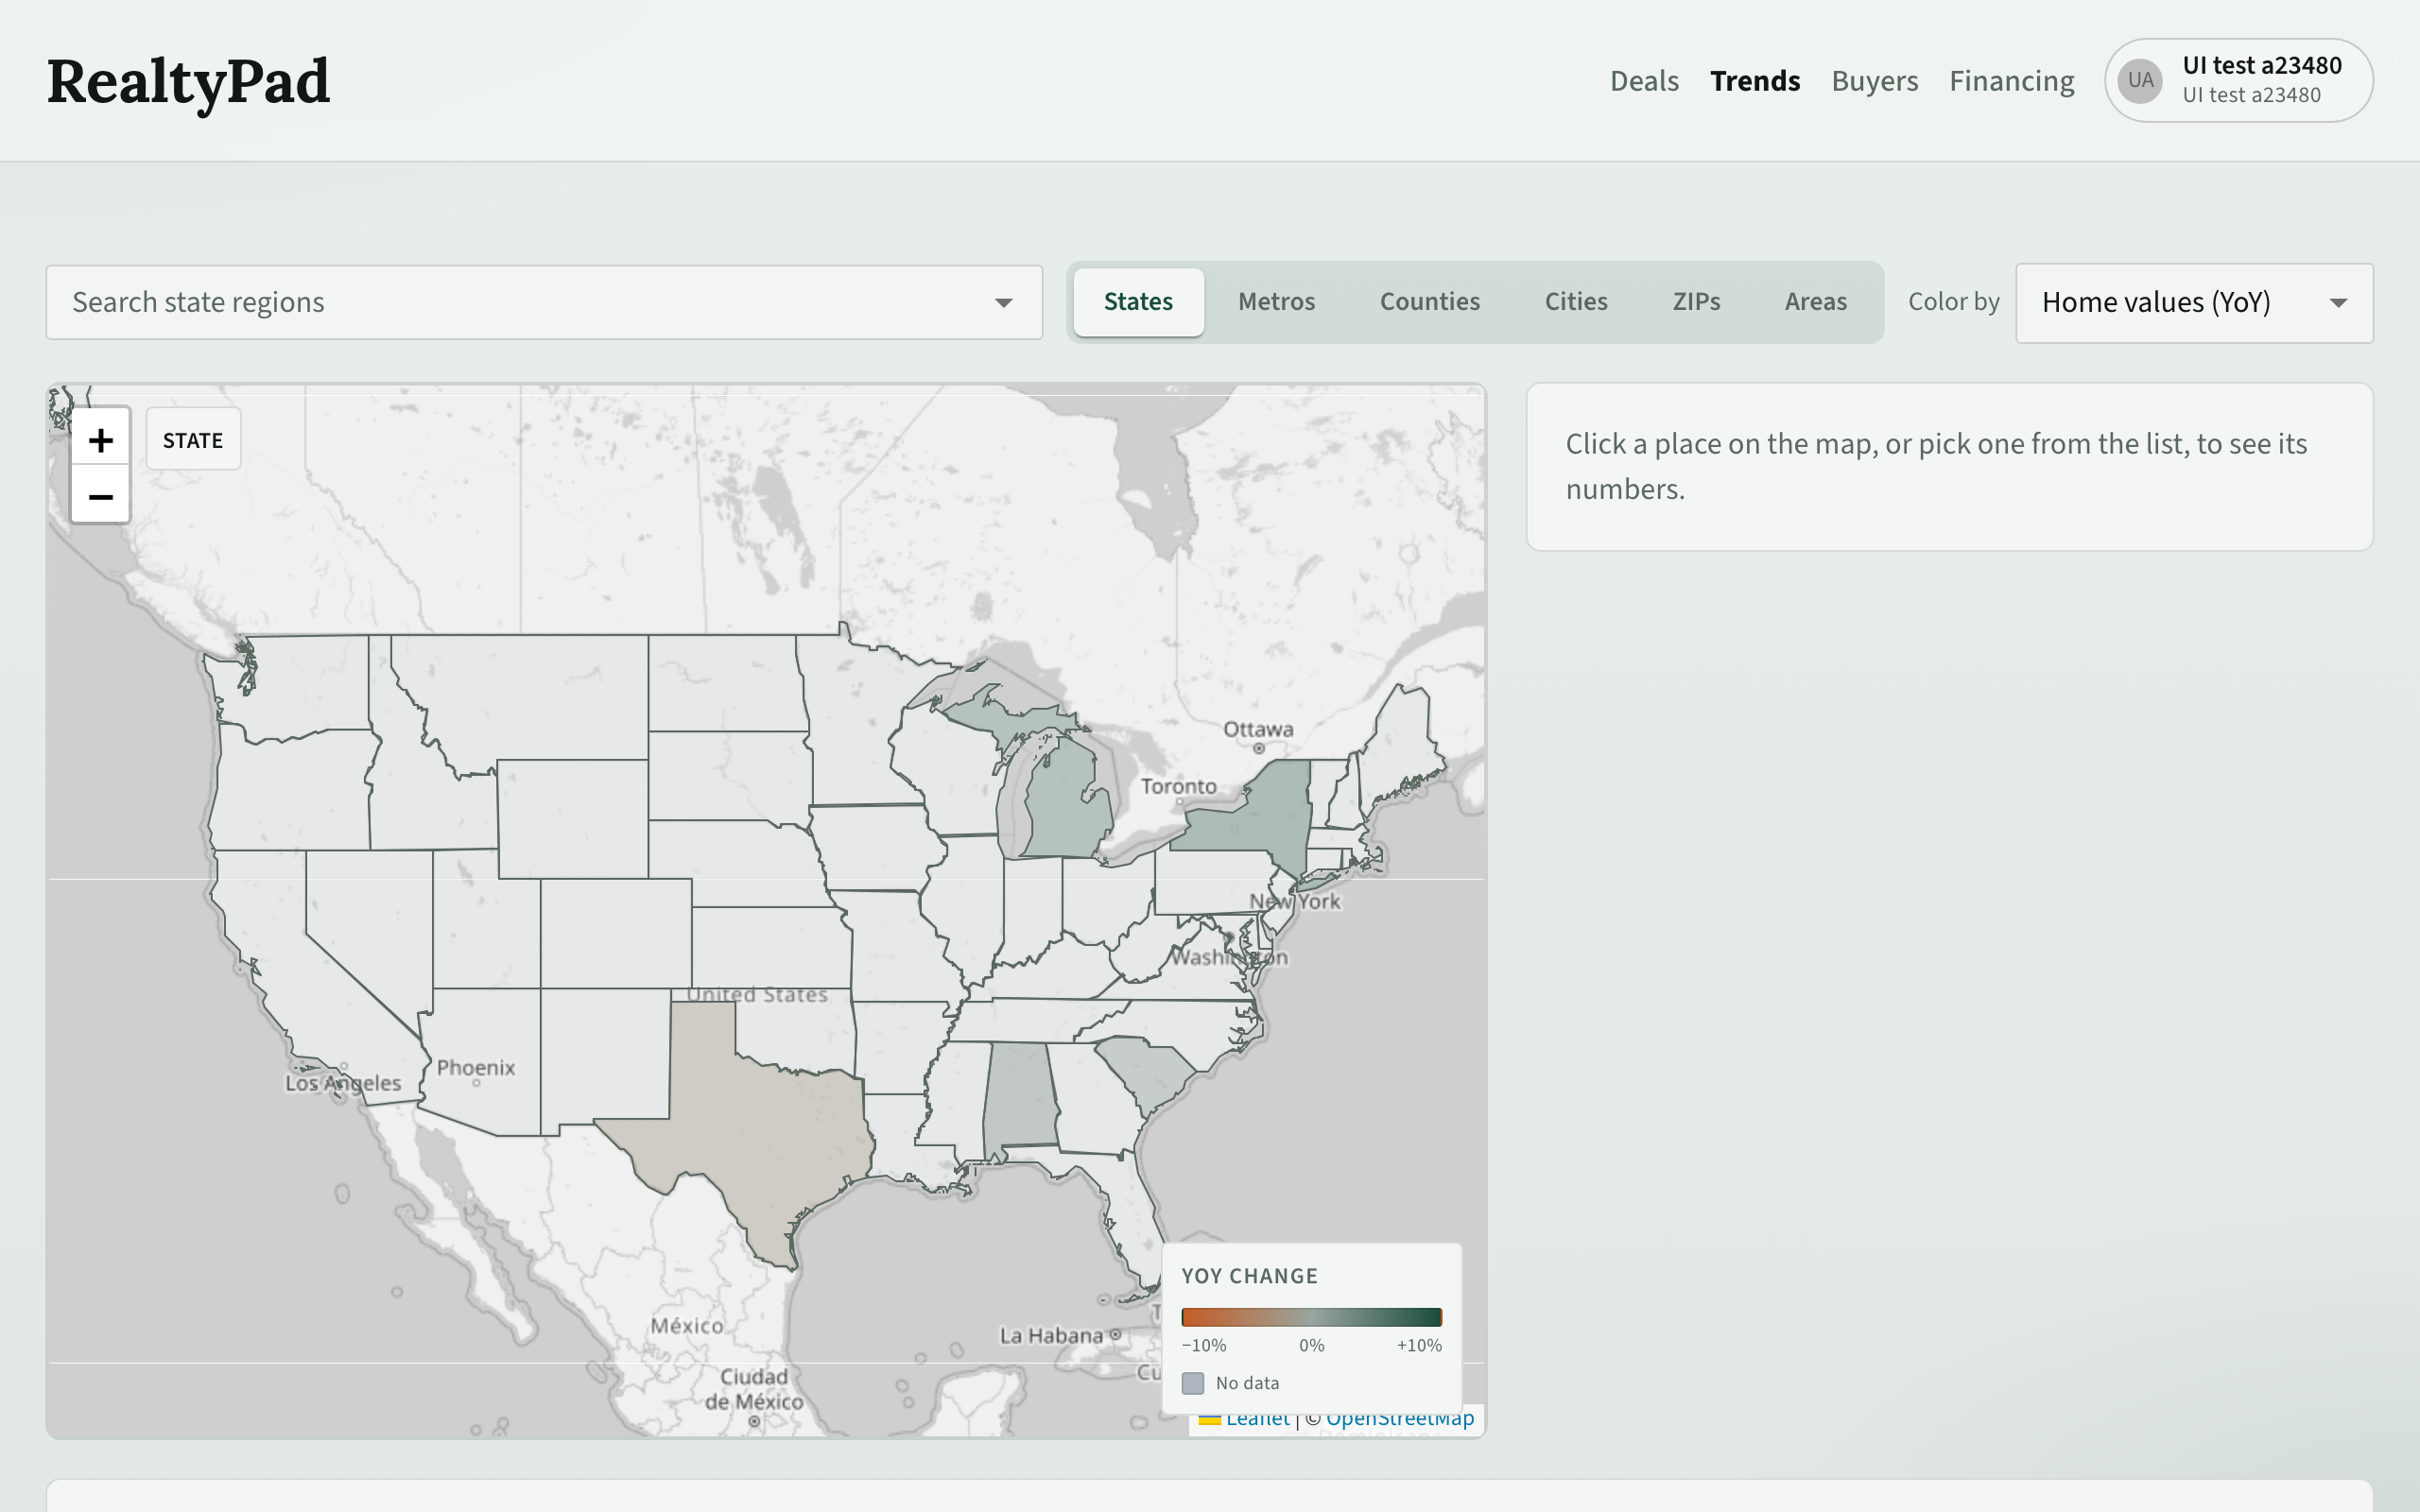
The Trends page is a map of home value and rent changes across the US, so you can compare markets before you look at single deals.
Open it with Trends in the top menu, or go to /trends.
Pick a geography level
Use the level switch above the map to choose how fine the map is:
| Level | What the map shows |
|---|---|
| States | One shape per state (the default). |
| Metros | Metro areas (MSAs). |
| Counties | Counties. |
| Cities | Cities. |
| ZIPs | ZIP code areas. |
| Areas | Neighborhoods. |
When you zoom far into the map, a Switch to … button can appear at the top of the map. Click it to move to a finer level for that view.
Search for a place
- Choose a level.
- Type in the search box (for example Search metro (msa) regions). The list shows matching places from the current level.
- Pick a place. It is added as a chip in the box and selected on the map.
You can pick several places. Each one gets its own tab in the charts below the map, so you can compare them. Click the × on a chip to remove it.
Color the map
Use Color by to choose what the colors mean:
- Home values (YoY) — change in home values over the past year.
- Rents (YoY) — change in rents over the past year. This is only available for Metros, Counties, Cities and ZIPs, because rent figures are not published for states or neighborhoods.
Read the legend
The YoY change legend in the corner of the map shows the color scale, from −10% on the left (prices or rents falling) through 0% to +10% on the right (rising). Places with a grey No data color have no figures for the chosen measure.
Hover over a place to see its name and its YoY change.
Below the map, Places on the map lists the places in view, sorted by the chosen measure. Click a row to select that place.
The details panel
Click a place on the map, or pick one from the list, to fill the details panel next to the map.
The panel shows the latest figures when they are available:
- Home value, with its change this year
- Rent, with its change this year
- Rent vs. price — a year of rent divided by the home value
- Unemployment
- Days on market (median)
- Population
From the panel you can:
- Click See my deals here to open your Deals list filtered to that market.
- Click All charts to jump to the full charts below.
- Click Refresh trends to fetch the newest figures for that place.
- Click Triage market to open Triage for that market.
- Click Copy link to copy a link to this exact view (level, places, color and selection).
Charts
The charts section shows the history for the selected place. Use the controls above the charts:
- Lookback — 3y, 5y, 10y or All.
- Project — turn a projection line on or off.
- Empty — show or hide charts that have no data.
- Period — Monthly, Quarterly or Yearly points.
Use the arrow button to collapse or expand the charts.
How trends relate to your deals
Each deal has its own Trends tab with the series for the markets around that property. Those market trends feed the deal's Growth score, which is separate from the Drivers score for local demand signals. Both feed the deal's Overall score. See Deal evidence tabs.